Education / Selected work
Recovering the reproduction number from hospital admissions alone
How much of an epidemic’s transmission history can be recovered from hospital admissions alone — no case counts, no test data, no contact tracing?A summary of the paper, with its own figures. The full write-up is linked at the foot of the page.
The question
The reproduction number is the figure a government needs and the one thing that cannot be measured. It has to be inferred from something countable. Through the pandemic that was positive tests — a series that moved with testing capacity, with how willing people were to be tested, with whether tests were free, and with the self-tests that were never recorded at all.
Hospital admissions are recorded for a different reason. Somebody admitted with COVID-19 is admitted because they are ill, not because they sought out a test. So the question is whether admissions alone can carry the transmission history: no case counts, no test data, no contact tracing.
Why a compartmental model
Turning a transmission rate into a reproduction number needs the susceptible fraction, S(t)/N, and S(t) appears in no dataset. It is the accumulated consequence of every infection and every lapse of immunity since the beginning. Only a model that carries the population’s infection history forward can supply it. Smoothing the admissions curve tells you about admissions and nothing else.
β is not assumed. It is estimated, as 72 piecewise-constant values across the window — one per bucket — so the shape of transmission is recovered from the data rather than imposed on it.
The fit
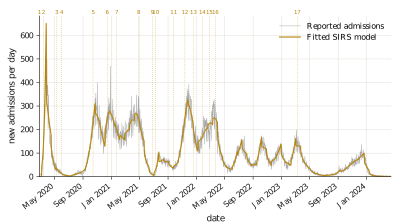
A SIRS model with piecewise-constant transmission, fitted to 1,495 days of Dutch COVID-19 hospital admissions from 2020-02-27 to 2024-04-15. Seventy-five free parameters: 72 transmission values, plus a hospitalisation ratio, a reporting delay and an initial infectious population. They are estimated by bounded nonlinear least squares from 48 random restarts, on 21-day buckets. The baseline reaches an RMSE of 25.1 admissions per day; the same model without waning immunity reaches 25.5.
The check
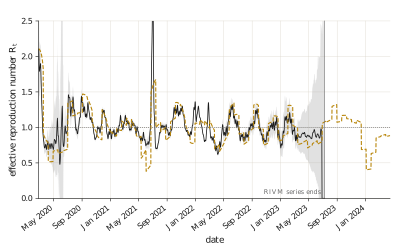
RIVM publishes its own reproduction number, estimated by a different method from a different data stream. It enters neither the model nor the fit at any point. So comparing the two is out-of-sample against an independent estimate, and it is the only part of this work that can say whether the recovered transmission history is real rather than merely well-fitting.
At the model’s own 21-day resolution the correlation is 0.804 across 54 intervals. The two series agree on direction 81.5% of the time, against 50.0% for the best constant, and the model sits inside RIVM’s 95% interval in 50.0% of intervals against 38.9% for the best constant.
Where it gets interesting
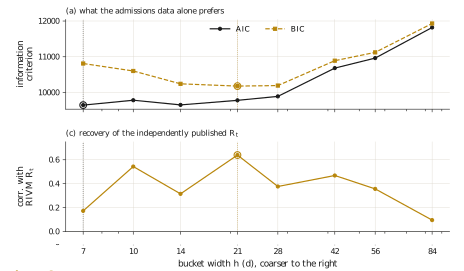
The complexity that fits the admissions best recovers the reproduction number worst. AIC selects 7-day buckets and 219 parameters — the closest fit to admissions of any width tried, with RMSE falling from 51.4 admissions per day at 84-day buckets to 21.8 at 7-day. Its daily correlation with RIVM is 0.173, the worst of every width. BIC selects 21-day buckets and 75 parameters, a measurably worse fit to admissions, and scores 0.639.
The mechanism is not subtle. Past a certain resolution the extra control values are no longer resolving finer structure in transmission; they are absorbing reporting noise. Every unit of admissions error they remove is bought by deforming the latent path that produced it. And because the deformation shrinks the residuals, no statistic computed from the fit can detect it.
A diagnostic that needs nobody else’s data
Most people fitting a model like this have no published series to check against. That is usually why they are fitting it. But the infection-to-admission delay is estimated from the same data, and a reader already knows roughly what it should be. At the bad widths it collapses to 1.8–2.2 days — at 7, 14 and 28-day buckets — which is physiologically impossible. At 10 and 21-day buckets it sits at 8.5–9.1 days.
It is a one-sided filter. An implausible delay is good evidence to reject a parameterisation; a plausible one is not evidence to accept it.
One thing the model separates that the raw series cannot
Measures took effect on 2020-03-15 and admissions peaked 11 days later, on 2020-03-26. That lag has been read in public discussion as the time the measures took to work, which conflates two different delays. The fitted infection flux peaks on 2020-03-18, three days after the measures. The remaining eight days are the infection-to-admission delay, independently estimated at 9.1 days.
So transmission turned within days, and most of the visible lag was the time it took the hospital system to register that it had.
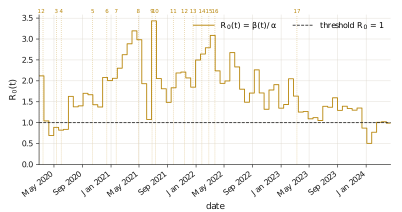
Across the whole window the estimated R0(t) runs from 0.50 to 3.43, with a mean of 1.72.
What broke
Three implementation faults were found by verification. Each changed the results, and none would have shown up in goodness of fit.
- 105 days of missing data were fitted as if nobody had been admitted.
- The reporting delay was discretised to whole days, which made its finite-difference gradient exactly zero, so it could not be estimated at all.
- The integrator stepped blind across the discontinuities in β(t): tightening the tolerance from 1e-7 to 1e-8 moved the maximum error from 30.49 to 30.50 admissions per day — the wrong way.
What this does not show
- It is a retrospective reconstruction, not a nowcast. The whole window is fitted at once, so the March 2020 estimate uses 2024 data.
- The hospitalisation ratio is held constant across four years in which vaccination and variants certainly changed it, which biases R0(t) downward after early 2021.
- Absolute scale is weaker than shape. Two fits of near-identical quality — RMSE 25.1 against 25.5 — disagree by a factor of 4.4 about the hospitalisation ratio and 3.4 about the initial infectious population.
- The counterfactual sweeps are statements about the model, not about the Netherlands.
Written for Simuleren en Modelleren · BSc Mathematics · University of Amsterdam · January 2026. Revised and published September 2026.